SAS® VISUAL ANALYTICS
SAS® Visual Analytics is a business intelligence solution that uses intelligent auto-charting to help business analysts and non-technical users visualize data. It creates the best possible visual based on the data that is selected. The visualizations make it easy to see patterns and trends and identify opportunities for further analysis.
See what you've been missing
No matter the size of your organization – or your data – you can explore all relevant data quickly and easily. Interactive data visualization software lets you look at more options, uncover hidden opportunities, identify key relationships and make precise decisions faster than ever before. Self-service, ad hoc visual data discovery and exploration put lightning-fast.
Curious? Get Answers. Fast.
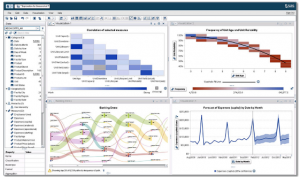
Now anyone can make sense of complex data, regardless of analytic skill level (or lack thereof). We’ve combine sophisticated analytics – decision trees, network diagrams, on-the-fly forecasting, goal seeking and scenario analysis, path analysis and text sentiment analysis – with ease-of-use features, such as autocharting, “what does it mean” pop-ups and drag-and-drop capabilities. The result is data visualization software that supports BI reporting and dashboards, plus data exploration and analytics – delivered through a single interface. Absolutely no coding required.
Say goodbye to static BI. Add analytics and modelling to your toolkit
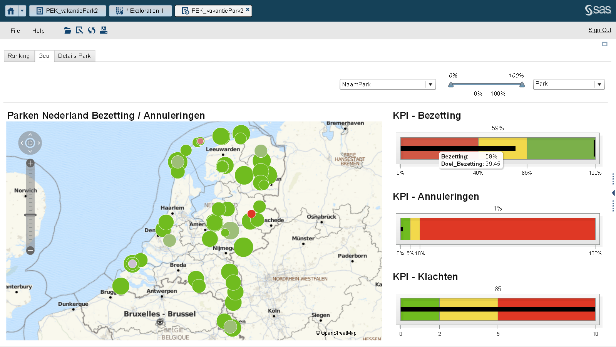
Quickly create interactive reports that are attractive and meaningful. Then easily share them via the web, mobile devices and Microsoft applications through integration with SAS® Office Analytics. Recipients can slice and dice the information however they want, using filters and drill-through capabilities. And that’s not all. Go beyond BI by exploring your data through interactive analytic visualizations. And when you’re ready for the next step, you can start building analytical models using the SAS® Visual Statistics add-on.
Get The Power To Know® on the go
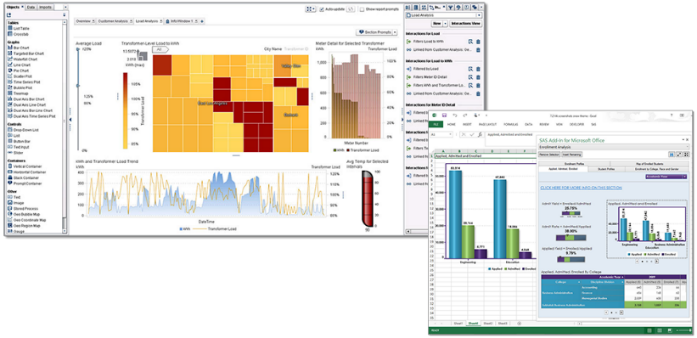
No more “I’ll get back to you on that.” Now you can get insights immediately, no matter where you are. With mobile BI capabilities, executives and decision makers can access and explore dashboards and reports easily from tablets and smartphones, anytime and anywhere. Mobile tethering even lets you explore reports when there’s no Internet connectivity. With data visualization tools powered by analytics, answers are always within reach.

Right-size your data exploration environment. Today and always
Think you can’t afford the world’s best analytics? Now you can. From individual analysis to exploratory analytics, we support whatever size environment you require. Whether on-site or in a cloud (including the SAS Cloud), we have an option that will fit your needs. And when your business grows, we’ll grow along with you. Integrate more – and bigger – data sets. Apply more complex analytical techniques. SAS Visual Analytics will fit you now and in the future.
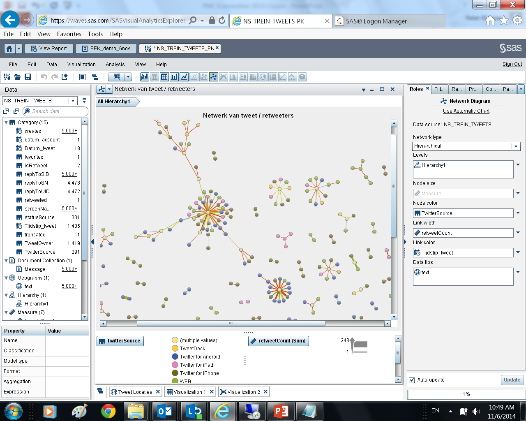
Tap into the power of social media and other text data.
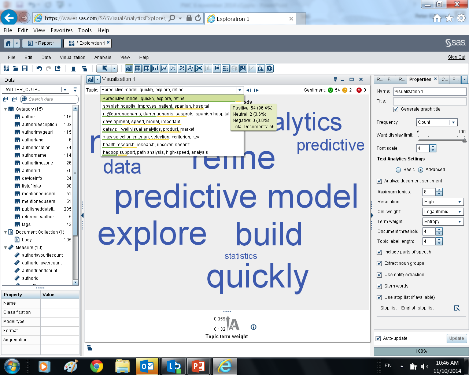
Everybody’s talking. Know what’s being said – good and bad – about your company or products by applying sentiment analysis to text data from Twitter, Facebook, Google Analytics or any other text data stored in Hadoop. Gain quick insights into the “hot topics” of the day, and get in front of opportunities and issues. Analytics applied behind the scenes determines which words are used most frequently and identifies the sentiment behind them – positive, negative or neutral. You can then decide which topics warrant further exploration. Or action.
